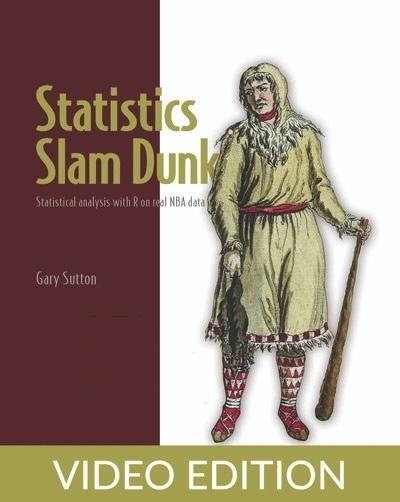
English | MP4 | AVC 1280×720 | AAC 44KHz 2ch | 17h 49m | 2.71 GB
Learn statistics by analyzing professional basketball data! In this action-packed book, you’ll build your skills in exploratory data analysis by digging into the fascinating world of NBA games and player stats using the R language.
Statistics Slam Dunk is an engaging how-to guide for statistical analysis with R. Each chapter contains an end-to-end data science or statistics project delving into NBA data and revealing real-world sporting insights. Written by a former basketball player turned business intelligence and analytics leader, you’ll get practical experience tidying, wrangling, exploring, testing, modeling, and otherwise analyzing data with the best and latest R packages and functions.
In Statistics Slam Dunk you’ll develop a toolbox of R programming skills including:
- Reading and writing data
- Installing and loading packages
- Transforming, tidying, and wrangling data
- Applying best-in-class exploratory data analysis techniques
- Creating compelling visualizations
- Developing supervised and unsupervised machine learning algorithms
- Executing hypothesis tests, including t-tests and chi-square tests for independence
- Computing expected values, Gini coefficients, z-scores, and other measures
If you’re looking to switch to R from another language, or trade base R for tidyverse functions, this book is the perfect training coach. Much more than a beginner’s guide, it teaches statistics and data science methods that have tons of use cases. And just like in the real world, you’ll get no clean pre-packaged data sets in Statistics Slam Dunk. You’ll take on the challenge of wrangling messy data to drill on the skills that will make you the star player on any data team.
Statistics Slam Dunk is a data science manual with a difference. Each chapter is a complete, self-contained statistics or data science project for you to work through—from importing data, to wrangling it, testing it, visualizing it, and modeling it. Throughout the book, you’ll work exclusively with NBA data sets and the R language, applying best-in-class statistics techniques to reveal fun and fascinating truths about the NBA.
Is losing basketball games on purpose a rational strategy? Which hustle statistics have an impact on wins and losses? Does spending more on player salaries translate into a winning record? You’ll answer all these questions and more. Plus, R’s visualization capabilities shine through in the book’s 300 plots and charts, including Pareto charts, Sankey diagrams, Cleveland dot plots, and dendrograms.
What’s inside
- Transforming, tidying, and wrangling data
- Applying best-in-class exploratory data analysis techniques
- Developing supervised and unsupervised machine learning algorithms
- Executing hypothesis tests and effect size tests
Table of Contents
1 Getting started
2 Why R
3 How this book works
4 Summary
5 Exploring data
6 Importing data
7 Wrangling data
8 Variable breakdown
9 Exploratory data analysis
10 Writing data
11 Summary
12 Segmentation analysis
13 Loading packages
14 Importing and viewing data
15 Creating another derived variable
16 Visualizing means and medians
17 Preliminary conclusions
18 Sankey diagram
19 Expected value analysis
20 Hierarchical clustering
21 Summary
22 Constrained optimization
23 Loading packages
24 Importing data
25 Knowing the data
26 Visualizing the data
27 Constrained optimization setup
28 Constrained optimization construction
29 Results
30 Summary
31 Regression models
32 Importing data
33 Knowing the data
34 Identifying outliers
35 Checking for normality
36 Visualizing and testing correlations
37 Multiple linear regression
38 Regression tree
39 Summary
40 More wrangling and visualizing data
41 Importing data
42 Wrangling data
43 Analysis
44 Summary
45 T-testing and effect size testing
46 Importing data
47 Wrangling data
48 Analysis on 2018-19 data
49 Analysis on 2019-20 data
50 Summary
51 Optimal stopping
52 Importing images
53 Importing and viewing data
54 Exploring and wrangling data
55 Analysis
56 Summary
57 Chi-square testing and more effect size testing
58 Importing data
59 Wrangling data
60 Computing permutations
61 Visualizing results
62 Statistical test of significance
63 Effect size testing
64 Summary
65 Doing more with ggplot2
66 Importing and viewing data
67 Salaries and salary cap analysis
68 Analysis
69 Summary
70 K-means clustering
71 Importing data
72 A primer on standard deviations and z-scores
73 Analysis
74 K-means clustering
75 Summary
76 Computing and plotting inequality
77 Loading packages
78 Importing and viewing data
79 Wrangling data
80 Gini coefficients
81 Lorenz curves
82 Salary inequality and championships
83 Salary inequality and wins and losses
84 Gini coefficient bands versus winning percentage
85 Summary
86 More with Gini coefficients and Lorenz curves
87 Importing and viewing data
88 Wrangling data
89 Gini coefficients
90 Lorenz curves
91 For loops
92 User-defined functions
93 Win share inequality and championships
94 Win share inequality and wins and losses
95 Gini coefficient bands versus winning percentage
96 Summary
97 Intermediate and advanced modeling
98 Importing and wrangling data
99 Exploring data
100 Correlations
101 Analysis of variance models
102 Logistic regressions
103 Paired data before and after
104 Summary
105 The Lindy effect
106 Importing and viewing data
107 Visualizing data
108 Pareto charts
109 Summary
110 Randomness versus causality
111 Importing and wrangling data
112 Rule of succession and the hot hand
113 Player-level analysis
114 League-wide analysis
115 Summary
116 Collective intelligence
117 Importing data
118 Wrangling data
119 Automated exploratory data analysis
120 Results
121 Summary
122 Statistical dispersion methods
123 Importing data
124 Exploring and wrangling data
125 Measures of statistical dispersion and intra-season parity
126 Churn and inter-season parity
127 Summary
128 Data standardization
129 Importing and viewing data
130 Wrangling data
131 Standardizing data
132 Summary
133 Finishing up
134 Significance testing
135 Effect size testing
136 Modeling
137 Operations research
138 Probability
139 Statistical dispersion
140 Standardization
141 Summary statistics and visualization
Resolve the captcha to access the links!