English | MP4 | AVC 1920×1080 | AAC 44KHz 2ch | 24 Lessons (1h 13m) | 0.97 GB
Developer tooling within browsers is more powerful than ever, but this brings its own set of problems: there’s just so much! How does it all work? Which bits do I need? What does this even do?
When I’m auditing a site’s performance, there is a large but specific subset of DevTools that I actually care about, and I need it set up just right. This allows me to work tactically and effectively, but also opens up a whole world of possibilities that many developers aren’t even aware of.
In this video course, I’m going to show you how to set up DevTools PERFectly—as forensic, accurate, and dialled in as possible. We’ll learn how to:
- Create sensible defaults
- Unlock new and hidden features
- Demystify existing settings
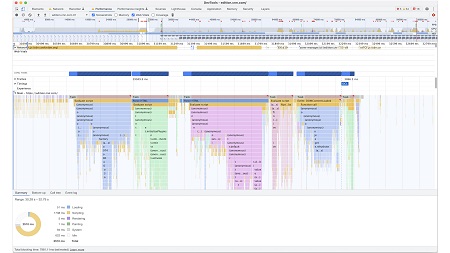
- Make sense of various graphs and charts
- Investigate new workflows
- Loads of neat tips and tricks
- And a whole host more.
The course itself won’t make you a performance expert, but it will help you to hone and refine your tooling and workflow so that you can get there a lot faster.
I think you’re gonna like this one.
Table of Contents
1 Focus_debuggee
2 Initiator_highlighting
3 Header_Overrides
4 Searching
devtools
Start Here
5 Start Here
Basic Setup
6 New Profile
7 Dock to Bottom
Network Panel
8 Better Defaults
9 Large Request Rows
10 Group by Frame
11 Capture Screenshots
12 Show Overview
13 Priorities
14 Filter
15 Search
16 Throttling
Sources Panel
17 Local Overrides
18 Snippets
Experiments
19 Experiments
Performance Panel
20 Performance Panel
New Stuff
21 Recorder
22 Performance Monitor
23 Protoco _Monitor
24 Lighthouse
Resolve the captcha to access the links!