English | MP4 | AVC 1280×720 | AAC 48KHz 2ch | 2h 23m | 443 MB
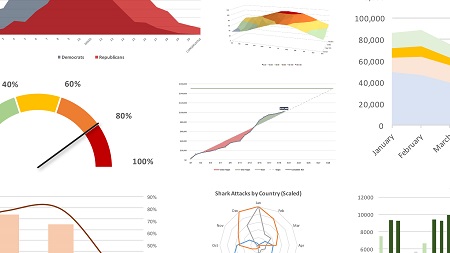
When you think data visualization, you might not think Microsoft Excel. But Excel offers a large number of charts and graphing tools that complement its data analysis toolset. This course offers a laser-focused, practical guide to over 20 useful Excel charts and graphs for data visualization. Instructor Chris Dutton reviews the key principles of data visualization, and provides some introductory tips to help you customize any kind of chart in Excel. In this section, you can learn how to adjust text and cell formatting, change the chart type and axes, and leverage built-in templates. In chapter three, Chris reviews the different chart types: from basic bar and pie charts, to scatter plots, histograms, funnel charts, and sparklines. Plus, learn how to create geospatial heat maps and 3D power maps, and combine different chart types on one sheet.
Topics include:
- Data visualization best practices
- Customizing charts
- Applying templates
- Using bar and column charts
- Creating scatter plots
- Building geospatial maps with Power Map
Table of Contents
Introduction
1 Part 1 – Introduction
Data Visualization Best Practices
2 Key principles and the 10-second rule
3 The good the bad and the ugly
4 The three key questions
Customizing Charts in Excel
5 Setting expectations
6 Chart elements layouts colors and styles
7 Chart formatting options
8 Changing chart types and axis options
9 Creating modifying and applying templates
Mastering Basic Charts and Graphs
10 Bar and column charts
11 Histograms and Pareto charts
12 Line charts and trendlines
13 Area charts
14 Pies donuts and race tracks
15 Scatter plots
16 Bubble charts
17 Box and whisker charts
18 Tree maps and sunburst charts
19 Waterfall charts
20 Funnel charts
21 Radar charts
22 Stock charts
23 Heat maps
24 Surface and contour charts
25 Geospatial maps Power Map
26 Basic combo charts
27 Sparklines
Wrapping Up
28 Part 1 – Conclusion
Resolve the captcha to access the links!