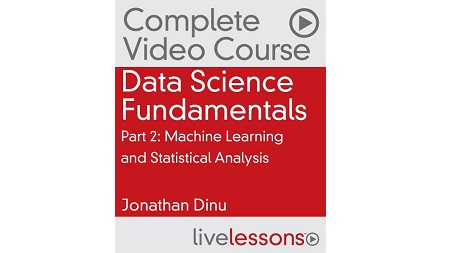
English | MP4 | AVC 1280×720 | AAC 44KHz 2ch | 20h 30m | 2.92 GB
Data Science Fundamentals Part II teaches you the foundational concepts, theory, and techniques you need to know to become an effective data scientist. The videos present you with applied, example-driven lessons in Python and its associated ecosystem of libraries, where you get your hands dirty with real datasets and see real results.
If nothing else, by the end of this video course you will have analyzed a number of datasets from the wild, built a handful of applications, and applied machine learning algorithms in meaningful ways to get real results. And all along the way you learn the best practices and computational techniques used by professional data scientists. You get hands-on experience with the PyData ecosystem by manipulating and modeling data. You explore and transform data with the pandas library, perform statistical analysis with SciPy and NumPy, build regression models with statsmodels, and train machine learning algorithms with scikit-learn. All throughout the course you learn to test your assumptions and models by engaging in rigorous validation. Finally, you learn how to share your results through effective data visualization.
What You Will Learn
- How to get up and running with a Python data science environment
- The basics of the data science process and what each step entails
- How (and why) to perform exploratory data analysis in Python with the pandas library
- The theory of statistical estimation to make inferences from your data and test hypotheses
- The fundamentals of probability and how to use scipy to work with distributions in Python
- How to build and evaluate machine learning models with scikit-learn
- The basics of data visualization and how to communicate your results effectively
- The importance of creating reproducible analyses and how to share them effectively
Table of Contents
01 Topics
02 7.1 Introduction to the pandas Library, Part 1
03 7.1 Introduction to the pandas Library, Part 2
04 7.1 Introduction to the pandas Library, Part 3
05 7.2 Data Manipulation with Pandas
06 7.3 Grouping and Summarizing Data with Pandas
07 7.4 Exploratory versus Explanatory Visualization, Part 1
08 7.4 Exploratory versus Explanatory Visualization, Part 2
09 7.5 Visualizing One Dimension – Histograms and Boxplots
10 7.6 Visualizing Two Dimensions – Bars, Lines, and Scatterplots
11 7.7 Multivariate Visualization – Facets, Small Multiples, and Dashboards, Part 1
12 7.7 Multivariate Visualization – Facets, Small Multiples, and Dashboards, Part 2
13 7.8 Visualizing One Dimension – Histogram and KDE, Part 1
14 7.8 Visualizing One Dimension – Histogram and KDE, Part 2
15 7.9 Visualizing One Dimension – Comparing Distributions, Part 1
16 7.9 Visualizing One Dimension – Comparing Distributions, Part 2
17 7.9 Visualizing One Dimension – Comparing Distributions, Part 3
18 7.10 Visualizing Two Dimensions – Line Charts and Scatter Plots
19 7.11 Mixed Effects and Simpson’s Paradox
20 Topics
21 8.1 What Problem Is Statistics the Answer To–Part 1
22 8.1 What Problem Is Statistics the Answer To–Part 2
23 8.2 The Statistical Framework – Descriptive, Inferential, and Predictive
24 8.3 Non-Parametric Estimation–The Bootstrap
25 8.4 Quantifying Uncertainty–Confidence Intervals, Part 1
26 8.4 Quantifying Uncertainty–Confidence Intervals, Part 2
27 8.5 Correlation versus Causation, Part 1
28 8.5 Correlation versus Causation, Part 2
29 8.5 Correlation versus Causation, Part 3
30 8.6 Evaluating Hypotheses–Significance Testing, Part 1
31 8.6 Evaluating Hypotheses–Significance Testing, Part 2
32 8.6 Evaluating Hypotheses–Significance Testing, Part 3
33 8.6 Evaluating Hypotheses–Significance Testing, Part 4
34 8.6 Evaluating Hypotheses–Significance Testing, Part 5
35 8.7 Experimental Design–Assumptions and Caveats
36 8.8 Review–Which Approach to Choose
37 Topics
38 9.1 What, Why, and How Machines Learn
39 9.2 A Machine Learning Taxonomy
40 9.3 Probability and Generative Models
41 9.4 Estimation with the Method of Moments
42 9.5 Maximum Likelihood Estimation
43 9.6 Computing the Maximum Likelihood Estimator, Part 1
44 9.6 Computing the Maximum Likelihood Estimator, Part 2
45 9.7 Introduction to Supervised Learning – Ordinary Least Squares Regression
46 9.8 Visualizing Regression with Seaborn
47 9.9 Analytical Regression with statsmodels
48 9.10 Interpreting Regression Models
49 9.11 Regression Three Ways – MLE, the Normal Equation, and Gradient Descent, Part 1
50 9.11 Regression Three Ways – MLE, the Normal Equation, and Gradient Descent, Part 2
51 9.11 Regression Three Ways – MLE, the Normal Equation, and Gradient Descent, Part 3
52 9.12 Evaluating Regression
53 9.13 Introduction to Classification – Logistic Regression
54 9.14 Components of a Model – The Hypothesis, Cost Function, and Optimization
55 9.15 Introduction to scikit-learn – Logistic Regression Appliedogistic Regression Example
56 9.16 Evaluating Classification Models
57 9.17 Evaluating Models with scikit-learn
58 9.18 Debugging Machine Learning – Imbalanced Classes
59 9.19 Model Selection–Hyperparameters and Regularization
Resolve the captcha to access the links!