English | MP4 | AVC 1280×720 | AAC 48KHz 2ch | 4h 52m | 1.17 GB
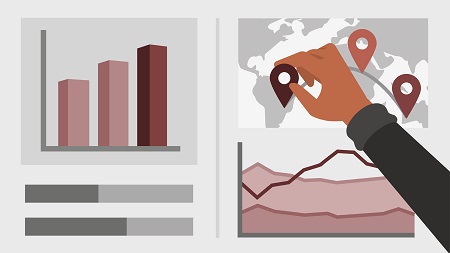
Power BI is a powerful data analytics and visualization tool that allows business users to monitor data, analyze trends, and make decisions. In this course, Helen Wall focuses on the front end of the Power BI application—the dashboard—where users interact with charts and graphs that communicate trends in their data. Throughout this course, Helen steps through how to design and customize the setup of visuals and charts to make it easy to use, understand, and interact with the dashboard model. Learn how to work with data from open-source websites, create visuals such as heatmaps and sparklines, compare multiple variables with trendlines and violin plots, and build engaging maps. To wrap up, she demonstrates how to create and share your finished product: an intuitive, engaging dashboard.
Topics include:
- Designing visuals and charts
- Customization options for visuals
- Drilling into hierarchies
- Using DAX in Power BI dashboards
- Setting up custom shapefile mapping
- Leveraging filter interactions and slicer capabilities
- Integrating trends into visuals
- Exporting and sharing dashboards
Table of Contents
1 Power BI ecosystem
2 Things to keep in mind
3 Selecting dashboard colors properly
4 Importing visuals into Power BI
5 Data sources for your analysis
6 Data queries
7 Joining tables in Power BI
8 Utilizing a report theme
9 Table visuals
10 Matrix visuals
11 Drilling into heirarchies
12 Applying static filters
13 Creating lists
14 Creating bins
15 Using DAX in Power BI dashboards
16 Using Quick Measures in Power BI dashboards
17 Challenge Designing your dashboard
18 Solution Designing your dashboard
19 Heatmaps in Power BI
20 Visualizing time-intelligence trends
21 Ranking categorical totals
22 Comparing proportions
23 Creating sparklines to quickly view trends
24 Setting up histograms
25 Challenge Develop the table visuals solution
26 Solution Develop the table visuals solution
27 Examining key performance indicators (KPI)
28 Visualizing trendlines as KPI
29 Forecasting with trendlines
30 Leveraging violin plots to quickly analyze a dataset
31 Visualizing flows with Sankey diagrams
32 Creating a scatter plot
33 Challenge Adding KPI metrics
34 Solution Adding KPI metrics
35 Obtaining shapefiles
36 Setting up custom shapefile mapping
37 Mapping with ArcGIS or ESRI
38 Configuring Mapbox layers to provide more detailed views
39 Mapping flow patterns
40 Challenge Mapping visuals
41 Solution Mapping visuals
42 High-level dashboard
43 Growth Rates dashboard
44 Local dashboard
45 Migration analysis dashboard
46 Adding slicers for filtering
47 Adding nudge prompts to promote interactions
48 Searching the dashboard with a slicer
49 Creating dynamic labels
50 Highlighting key points on the dashboard
51 Customizing tooltips to add visualizations without taking up space
52 Syncing slicers to filter pages
53 Configuring chiclet slicers
54 Showing the Top N rankings
55 Challenge Combined dashboard view
56 Solution Combined dashboard view
57 Setting up and formatting phone views
58 Exporting data
59 Creating templates
60 Creating PDF files
61 Uploading to the cloud
62 What can you do now
Resolve the captcha to access the links!